
Why Metrics Matter More Than Gut-Feel
Every project manager knows the feeling: a project looks fine until suddenly it isn’t. Timelines slip, budgets balloon, or stakeholders get frustrated — even though your weekly status reports showed everything “green.”
That’s where project management metrics come in. Instead of relying on gut instincts or colorful dashboards with no substance, metrics give you hard evidence: what’s working, what’s not, and where you need to act.
Over two decades of managing IT, construction, and cross-functional programs have taught me one truth: teams that measure the right things succeed more often. Those that don’t usually discover problems too late.
I’ve seen this firsthand. On one program, our burn rate looked fine until CPI (Cost Performance Index) revealed that cost creep had already eaten into 8% of the budget. Catching it early saved millions. That’s the difference between hoping you’re on track and knowing.
What Are Project Management Metrics? (And How They Differ From KPIs)
At the simplest level, project management metrics are measurements you track to understand project performance. They cover time, cost, quality, scope, and outcomes.
Here’s where many teams get stuck: not every metric should be treated as a KPI.
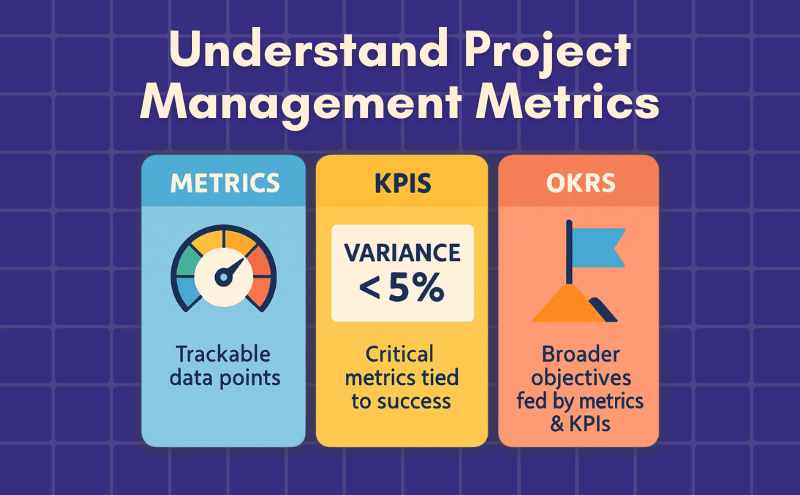
- Metrics are all the different data points you could track (like hours logged, defects found, or milestones due).
- KPIs (Key Performance Indicators) are the small set of critical metrics that directly reflect whether your project is meeting its objectives.
For example:
- Tracking the number of project meetings held is a metric. It tells you activity is happening, but not whether the project is successful.
- Measuring Customer Satisfaction (CSAT) or Net Promoter Score (NPS) is a KPI. If satisfaction scores drop below target, it’s a clear signal the project isn’t meeting expectations — even if timelines and budgets look fine.
In my 20+ years, I’ve seen teams drown in data because they try to track everything. The truth is, metrics without focus are noise. A well-run PMO will choose just 3–7 KPIs for each project, align them to business goals, and use the rest as supporting metrics to provide context.
If you’re ever unsure whether something is a KPI, ask: “Would this number alone convince leadership that the project is succeeding or failing?” If the answer is no, it’s a supporting metric, not a KPI.
How to Choose the Right Metrics
There’s no universal “top 10 list.” The right metrics depend on your project’s goals, context, and stakeholders. Over the years, I’ve found that teams often copy-paste metrics from templates — and end up tracking numbers that don’t matter. Instead, use a simple framework:
Start With Outcomes
Always begin with the end in mind: “What does success look like in the eyes of leadership or the client?”
- If the goal is financial efficiency → focus on Cost Performance Index, Cost Variance, and Estimate at Completion.
- If the goal is customer experience → emphasize Customer Satisfaction Scores, Net Promoter Score, or adoption and usage rates.
- If it’s about speed and delivery → track Schedule Performance Index, percentage of milestones completed on time, and average cycle time.
👉 Metrics should always connect back to business goals, not just activity inside the project plan.
Balance Leading and Lagging Indicators
Lagging indicators show what has already happened (like cost performance or schedule performance). They’re useful for measuring outcomes but don’t help you change direction quickly.
Leading indicators, on the other hand, provide early warnings (like backlog growth, defect discovery trends, or training attendance rates).
👉 A healthy dashboard combines both. Leading metrics act as radar, lagging ones as the rearview mirror.
Match Metrics to the Project Lifecycle
Different phases of a project demand different metrics:
- Initiation and Planning: estimation accuracy, completeness of the baseline plan.
- Execution: schedule performance, cost efficiency, quality of deliverables, and scope stability.
- Closeout: benefits realized, stakeholder satisfaction, and adoption rates.
👉 You don’t need to measure everything from the beginning. Focus on the most relevant indicators for the phase you’re in.
Set a Reporting Cadence
Not every metric needs the same frequency:
- Team-level metrics (like milestone progress or defects found) → weekly.
- Executive-level metrics (like cost efficiency or schedule performance) → monthly.
- Portfolio-level metrics (like value delivered vs. planned) → quarterly.
👉 If you review too often, you create noise. If you review too rarely, you miss warning signs.
Avoid Common Pitfalls
In my 20+ years, I’ve seen the same mistakes repeat:
- Tracking too many metrics without clear thresholds → paralysis.
- Using complex terms without explanation → confusion and mistrust.
- Sharing reports with no ownership → nothing gets acted on.
Begin with 3–7 well-defined Key Performance Indicators, agree on what “good, warning, and poor” looks like, and only add more once the team trusts and uses the system.
The Core Metric Families (With Formulas You Can Use)
To get a complete view of project success, you need to track metrics across five key families: schedule, cost, quality, scope and change, and value.
Schedule Metrics
These show whether the project is on track with time.
- Percentage of Milestones Completed on Time – should ideally be above 90%.
- Schedule Variance = Earned Value − Planned Value. Positive means ahead, negative means behind.
- Schedule Performance Index = Earned Value ÷ Planned Value. A value of 1.0 means on schedule.
Cost Metrics
These measure how efficiently you are using the budget.
- Cost Variance = Earned Value − Actual Cost.
- Cost Performance Index = Earned Value ÷ Actual Cost. Above 1.0 means efficient spending.
- Estimate at Completion – forecast of total cost if current trends continue.
Quality Metrics
These ensure the deliverables work as expected.
- Defect Density – defects per unit of deliverable.
- First-Pass Yield – work done correctly the first time.
- Reopen Rate – percentage of issues reopened after being marked complete.
Scope and Change Metrics
These show how well changes are being managed.
- Change Request Rate – number of requests during the project.
- Scope Creep Percentage – how much work has been added beyond the original plan.
Value and Outcome Metrics
These confirm whether the project creates impact.
- Benefit Realization Percentage – benefits achieved vs planned.
- Customer Satisfaction (CSAT) – how happy stakeholders are.
- Net Promoter Score (NPS) – whether stakeholders would recommend the outcome.
- Adoption Rate – how much the deliverable is actually used.
Benchmarks: What “Good” Looks Like
Metrics only matter if you know what “good” performance looks like. Over the years, I’ve seen leaders set unrealistic expectations — like demanding 100% of milestones on time or zero budget variance. In reality, even high-performing projects allow for some variation. Here are benchmarks backed by industry research and real-world experience:
- On-Time and On-Budget Success Rates Are Low: Only 16.2% of IT projects meet all three constraints (time, budget, scope), according to the Standish Group’s CHAOS Report [Standish Report, 2020]. This shows why realistic targets matter.
- Business Goal Alignment Is Stronger Than Just Delivery: PMI’s 2023 Pulse of the Profession found 72% of projects met their business goals — even when timelines slipped [PMI Pulse 2023].
- Agile Methods Improve Outcomes: Agile projects report ~64% success rates compared to lower rates in traditional waterfall approaches [Ravetree Project Management Stats 2025].
👉 Practical benchmark to aim for:
- Milestone completion: Above 90% (not 100% — because flexibility is needed).
- Cost efficiency: Cost Performance Index consistently ≥1.0 (you’re getting equal or better value than you spend).
- Stakeholder satisfaction: Customer Satisfaction Scores of 80%+ or Net Promoter Scores above 30.
Don’t chase “perfect.” Chase consistency. The best-performing teams I’ve worked with deliver predictably, not flawlessly.
Dashboards & Reporting Cadence
Metrics only create value when they’re visible, timely, and easy to act on. I’ve seen too many teams hide important data in spreadsheets that no one reviews — or worse, present flashy dashboards that overwhelm executives with 20 charts.
A good reporting system is about clarity and cadence:
- Team-level dashboards (weekly): Track operational details such as milestone progress, number of defects, backlog growth, or training attendance. These help the team catch issues before they escalate.
- Project manager dashboards (bi-weekly): Blend both detail and summary, showing indicators like schedule performance, cost performance, and quality trends. This helps you manage trade-offs in real time.
- Executive dashboards (monthly): Condense to 4–6 key performance indicators: cost efficiency, schedule adherence, benefit realization, and risk status. Leaders don’t need every data point — they need to know whether action is required.
- Portfolio dashboards (quarterly): Aggregate across multiple projects to show value delivered vs. planned, resource utilization, and strategic alignment.
The most effective dashboards I’ve used always highlight not just the metric, but the owner responsible for acting on it. Without that, numbers turn into wallpaper.
90-Day Implementation Plan
Rolling out project metrics can feel overwhelming — but you don’t need a six-month transformation. A focused 90-day playbook works well:
- Weeks 1–2: Audit and Align
Review what you already track. Most organizations have pockets of good data (like timesheets, defect logs, or financial reports) that aren’t being used. Sit down with sponsors and ask: “Which outcomes matter most to you?” - Weeks 3–4: Select 3–5 KPIs
Choose no more than five key indicators that directly reflect project success. Define what “green,” “yellow,” and “red” look like, so there’s no ambiguity later. - Weeks 5–8: Build Dashboards and Train
Create a simple dashboard (even Excel or Power BI works to start). Train teams on how to update data consistently and explain why these metrics matter. - Weeks 9–12: Refine and Expand
Drop vanity metrics that no one uses. Add leading indicators once the basics are stable. Share success stories to build trust — nothing motivates a team like seeing metrics help them prevent a crisis.
Early wins matter. On one client rollout, just showing executives a clear milestone dashboard within 30 days-built credibility and opened the door for broader adoption.
Common Pitfalls & How to Avoid Them
After 15+ years of doing this, I’ve noticed the same mistakes derail metric systems again and again. Here are the top ones to watch for:
- Tracking too many metrics
→ Teams get lost in data, executives tune out.
Fix: Start small. Focus on 3–7 meaningful KPIs, and expand later. - No clear thresholds
→ If “green” and “red” aren’t defined, reports become opinion battles.
Fix: Set thresholds in advance (e.g., milestone completion below 85% = red). - Focusing only on lagging indicators
→ By the time you notice problems, it’s too late.
Fix: Balance lagging metrics (like cost variance) with leading ones (like backlog growth or risk burn-down). - Metrics without ownership
→ Reports pile up but no one takes action.
Fix: Assign each KPI to a responsible owner with accountability. - Chasing “perfect” metrics
→ Teams waste time polishing numbers instead of fixing issues.
Fix: Aim for useful, not perfect. Metrics should guide decisions, not be an end in themselves.
When a team resists metrics, it’s usually because they’ve seen metrics used as punishment. Reframe them as tools for learning and course correction, not policing.
Wrapping Up
Metrics aren’t just numbers. They’re your compass. When chosen with care, tracked consistently, and aligned with outcomes, they transform projects from guesswork into dependable execution.
Start simple. Lead with impact. Over time, your metrics become your strongest ally in delivering real success.
FAQs
Can project metrics replace a project manager’s judgment?
No. Metrics provide evidence and early warnings, but they can’t capture every nuance. A project manager still needs to interpret the numbers, weigh context, and apply judgment. For example, a negative cost variance might not be a crisis if it’s tied to an intentional investment that accelerates future milestones.
How often should I update project metrics or dashboards?
The right frequency depends on the audience. Team-level dashboards benefit from weekly updates to catch issues early. Executive dashboards are usually updated monthly to focus on overall performance and value delivery. Portfolio dashboards work best on a quarterly cycle. Updating too often creates noise; too rarely makes data irrelevant.
What is the Goal → Question → Metric (GQM) approach?
The GQM framework helps teams avoid vanity metrics. You begin with a Goal (e.g., “Improve customer onboarding”). Then define Questions that reveal progress (e.g., “Are new hires completing onboarding within two weeks?”). Finally, track Metrics to answer those questions (e.g., average onboarding duration, training completion rates). This keeps metrics tied directly to outcomes.
Are there metrics specific to Agile or Scrum projects?
Yes. Agile projects often track additional metrics beyond cost and schedule performance. Common ones include:
- Velocity – the amount of work completed in each sprint.
- Sprint Burn-down Chart – tracks how much planned work remains in a sprint.
- Lead Time and Cycle Time – how long it takes to move work from request to completion.
- Escaped Defects – bugs found after release.
These metrics give Agile teams visibility into pace, predictability, and quality.
How can I automate project metrics tracking?
Manual data collection wastes time and introduces errors. Most modern project management tools integrate with financial systems, time trackers, or development tools to update dashboards automatically. For example, Power BI, Tableau, or Jira dashboards can pull data in real time. Automating updates reduces effort and ensures leaders always see the latest numbers.