What is a Project Dashboard?
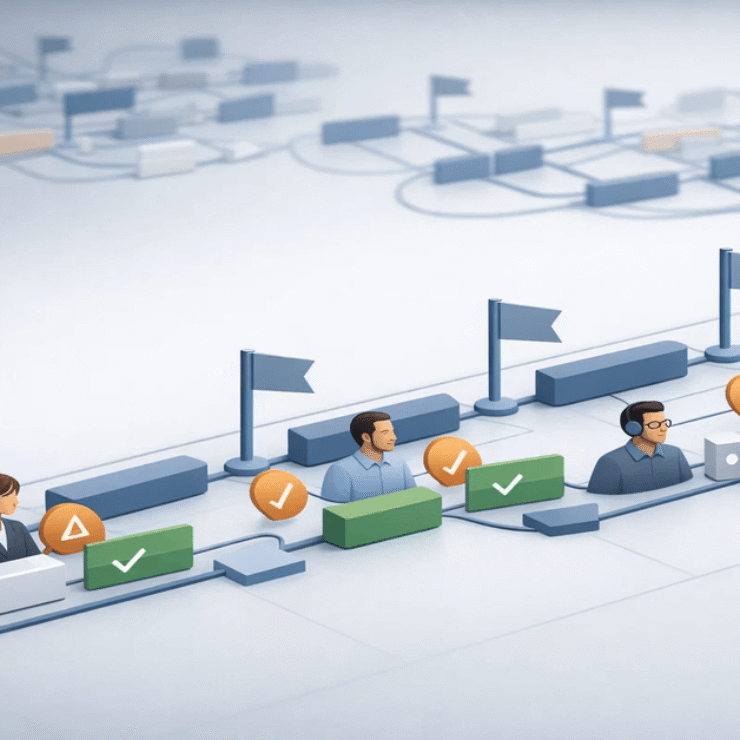
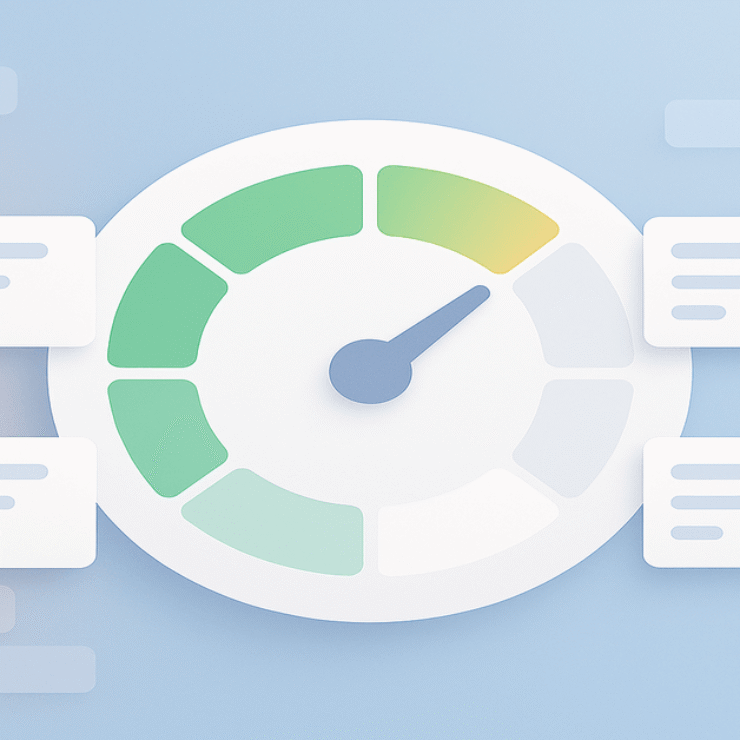
A project dashboard is a visual, real-time interface that consolidates all key project information into a single screen. It displays critical metrics, progress updates, and potential risks at a glance. Think of it as the cockpit of a plane, showing all the vital instruments in one place. It is the central hub for monitoring a project’s performance and health.
Insight: “In my 20+ years in IT, I’ve watched project management evolve from rigid, spreadsheet-heavy processes into a real-time, data-driven practice. The thing that changed everything? Dashboards. They don’t just show what happened—they help you see what’s coming and take control before problems even appear.”
The key difference between a dashboard and a traditional report is their purpose. A report is a static document that looks backward, summarizing data from a specific period. It’s useful for historical analysis but is outdated the moment it’s created. A dashboard is a dynamic, living tool that provides a live, forward-looking view of the project’s health, updating continuously to reflect the current state of the project.
What is a Dashboard in Project Management?
In project management, a dashboard is the nerve center of a project, providing a real-time view of progress and performance.
It helps answer critical questions instantly:
- Is the project on schedule?
- Are we staying within budget?
- Is the team’s workload balanced?
Dashboards transform scattered data—from spreadsheets, task lists, and communication tools—into a unified, actionable overview.
Key benefits include:
- Identify bottlenecks before they slow progress
- Anticipate risks and make proactive decisions
- Allocate resources effectively for maximum efficiency
Real-life insight: “In one of our IT projects, we were struggling to track multiple teams across different locations. Once we implemented a live project dashboard, we could instantly see which tasks were falling behind and who was overloaded. That visibility alone allowed us to reallocate resources and meet our deadlines without last-minute panic.”
Think of it like a cockpit for your project: everything you need to navigate successfully is visible at a glance.
Why Project Dashboards Matter in 2025
In today’s fast-paced world, projects are more complex than ever. Teams are often distributed, stakeholders are demanding, and the volume of data is immense. The days of relying on static spreadsheets and lengthy email updates are gone. In 2025, real-time visibility is the key to success. This is where a project dashboard becomes your most powerful tool.
Insight: “In one global project, our teams were operating across five time zones. The dashboard gave everyone a single source of truth, so tasks didn’t fall through the cracks, and project progress became instantly visible to all.”
A dashboard is much more than a simple report; it’s the control center for your project. It transforms scattered data into a clear, actionable overview, giving you and your team a single source of truth. This article will define what a project dashboard is, explore its purpose and benefits, and provide a comprehensive guide to creating and using one effectively.
What is the Purpose of a Dashboard?
The primary purpose of a dashboard is to provide clarity, control, and accountability. It takes the guesswork out of project management by offering a centralized view of performance. A dashboard tracks the most important aspects of a project, including:
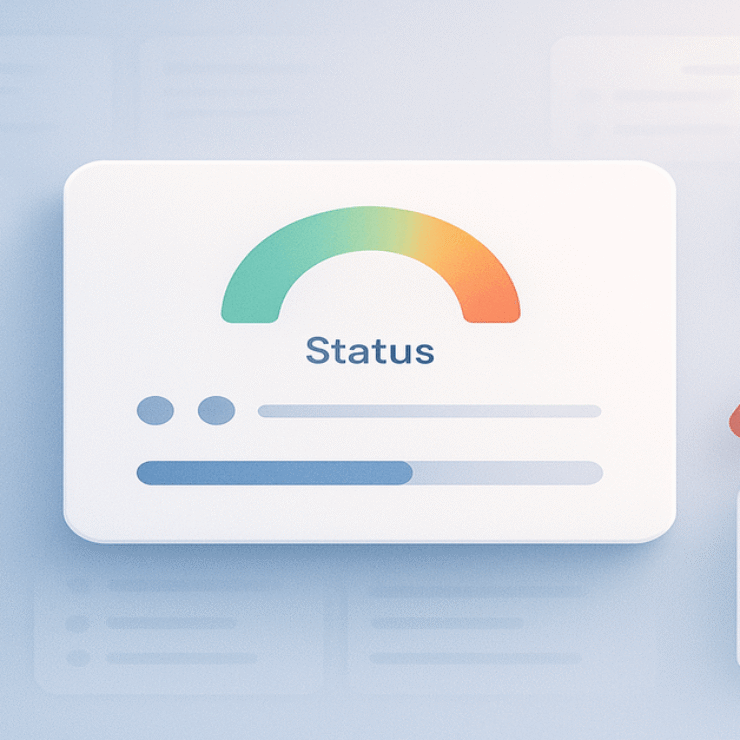
- Project Health: A quick, color-coded indicator (e.g., green for on-track, yellow for caution, red for at-risk) that provides an immediate sense of the project’s status.
- Budget: A clear comparison of planned vs. actual spending, helping to prevent financial overruns and ensuring cost-effectiveness.
- Resources: A visual representation of who is working on what and if anyone is over-allocated or under-utilized, enabling smarter resource management.
- Timelines: An overview of upcoming deadlines, key milestones, and critical path activities, ensuring the project stays on schedule.
- Risk & Issues: A log of identified risks and unresolved issues, ensuring that potential problems are not overlooked.
By centralizing this information, a dashboard helps decision-makers act quickly and proactively, preventing minor issues from becoming major problems. It shifts the project manager’s role from reporting on past events to strategically managing the project’s future.
Why Project Dashboards Are Essential in Project Management
The benefits of using a dashboard for project management are clear and significant. They are essential for any team that wants to be more transparent, efficient, and data-driven.
- Transparency for Stakeholders: A public, shared dashboard ensures that everyone, from the project team to senior leadership, is on the same page. This builds trust, fosters a collaborative culture, and reduces the need for constant, manual updates.
- Faster Decision-Making with Real-Time Data: With a live feed of key metrics, you can spot issues as they arise and make informed decisions immediately, instead of waiting for a weekly report. This agility is a significant competitive advantage.
- Eliminates Manual Reporting: A good dashboard automates data collection and visualization, freeing up countless hours that would otherwise be spent manually creating reports and compiling data from disparate sources.
- Aligns Teams Across Multiple Locations: In a remote or hybrid work environment, a dashboard acts as a virtual central office, ensuring every team member is aligned on the project’s goals and progress without the need for constant communication.
- Risk Management + Predictive Insights: By tracking key risk indicators and analyzing trends, dashboards can act as an early warning system. Some advanced dashboards even use AI to forecast future risks, allowing for proactive intervention before they escalate.
- Builds a Single Source of Truth for the Project: A dashboard becomes the official, undisputed source of project information, resolving conflicts that arise from outdated or conflicting data sources. This consistency is vital for large, complex projects.
Core Benefits of Using Project Dashboards
Each of these benefits contributes to a more efficient and successful project.
- Enhanced Transparency & Accountability: By making progress visible to all, dashboards hold individuals and teams accountable for their work. It’s difficult to hide delays or issues when everyone can see the data in real-time.
- Improved Communication: A centralized hub for data reduces the need for endless status meetings, allowing conversations to be more focused on problem-solving and strategy, not just basic updates.
- Data-Driven Decision-Making: Dashboards move teams away from gut feelings and anecdotal evidence towards objective, data-backed decisions. This leads to more reliable project outcomes.
- Saves Time with Automation: Automating data collection and reporting saves valuable time that can be reinvested in strategic tasks, such as risk analysis, team mentoring, and stakeholder management.
- Tracks Risks and Prevents Delays: Real-time monitoring allows for proactive intervention to keep the project on schedule and budget. For example, a dashboard can alert you to a critical task that is falling behind, allowing you to reallocate resources immediately.
Insight: “Before dashboards, we often reacted to issues too late. With real-time data, we shifted to proactive project management, and client satisfaction improved significantly.”
- Performance Benchmarking: You can use a dashboard to compare project performance against predefined goals, historical data, or industry standards, providing valuable context and a basis for continuous improvement.
- Easier Reporting for Clients/Leadership: A dashboard serves as an interactive, visually appealing report that can be shared with clients and executives with just a few clicks. It’s a professional and transparent way to communicate progress.
The 4 Types of Dashboards in Project Management
Not all dashboards are created equal. The most effective ones are tailored to their specific audience and purpose. Here are the four main types of dashboards in project management.
- Strategic Dashboards: Designed for senior executives and stakeholders, these provide a high-level view of the entire project portfolio. They focus on long-term goals, financial health, and overall project alignment. They answer questions like, “Are we meeting our business objectives?” and “Which projects are the most profitable?”
- Operational Dashboards: This is the project manager’s go-to tool. It provides a detailed, real-time view of daily tasks, team progress, and upcoming deadlines. It is an indispensable tool for day-to-day management and answers questions like, “What’s the status of this sprint?” and “Who is currently over-allocated?”
- Analytical Dashboards: Used by data analysts and experienced project managers, these dashboards dive deep into historical data to identify trends, pinpoint root causes of issues, and provide predictive insights for future projects. They often include complex metrics like cost variance analysis and resource efficiency ratios.
- Tactical Dashboards: These are focused on specific project components, such as resource utilization, cost tracking, or communication. They help managers optimize specific areas of a project, and are often created for a specific team or a particular project phase.
Project Dashboard Examples
To help you visualize these concepts, here are some project dashboard examples for different scenarios.
- Portfolio Management Dashboard: This type of dashboard shows an overview of multiple projects, with a color-coded status, budget summary, and key milestones for each. It helps executives make quick decisions about resource allocation across the entire organization.
- Project Status Dashboard: An operational dashboard for the project team, this would prominently display a burndown chart, a list of tasks due this week, and a timeline view of upcoming milestones. It keeps the team focused and motivated.
- Financial Dashboard: A financial dashboard shows a comparison of budget vs. actuals, a visual of the project’s burn rate, and a breakdown of costs by category. This is crucial for financial oversight and reporting.
- Resource Utilization Dashboard: This tactical dashboard helps balance workloads. It might use a bar chart to show each team member’s workload and highlight any individuals who are over-allocated. It’s a vital tool for preventing team burnout.
- Agile Dashboard: A specialized operational dashboard for Scrum teams, this would feature a sprint velocity chart, a visual of the team’s backlog, and a progress bar showing the current sprint’s completion rate.
The Anatomy of a Project Dashboard
A well-designed dashboard is a blend of science and art. Understanding the visual components is key to building one that is both informative and easy to read.
- KPI Widgets: These are small, single-metric displays that show a key performance indicator (KPI), often with a trend indicator. Examples include “Tasks Completed This Week” or “Budget Burn Rate.”
- Progress Bars: Simple and effective for showing progress towards a goal. Use them for task completion, budget usage, or milestone achievement.
- Gantt Charts: A classic project management tool, the Gantt chart shows tasks, their dependencies, and their timelines. It provides a comprehensive view of the project schedule.
- Burndown/Burnup Charts: These are essential for Agile projects. A burndown chart shows the work remaining in a sprint, while a burnup chart shows the work completed over time.
- Pie Charts: Best for showing proportions or a breakdown of a whole. Use them for budget allocation by department or task status by category.
- Bar/Column Charts: Excellent for comparing different values. Use them for comparing planned vs. actual costs, or team member workloads.
- Line Graphs: Ideal for showing trends over time, such as bug count, task velocity, or budget spending over the life of the project.
How to Create a Project Dashboard (Step-by-Step Guide)
If you’re wondering, “How do I create a project dashboard?”, follow these key steps.
Define the Audience: This is the most critical step. The metrics needed by a CEO are very different from those needed by a software developer. Create a persona for each audience you are building a dashboard for.
- Choose KPIs Aligned to Project Goals: Based on your audience, select a few key metrics that directly reflect the project’s success. For a marketing campaign, this might be website traffic and lead generation, while for a software project, it might be bug fix velocity.
- Pick the Right Tool/Software: The right tool will integrate with your existing workflow and meet your team’s needs. Consider factors like cost, learning curve, and integration capabilities. We’ll cover some options in the next section.
- Design for Clarity, Usability, and Mobile Access: A good design is simple and clean. The most important information should be easy to find. Use consistent color-coding and clear labels. Ensure the dashboard is responsive and works well on any device.
- Test, Gather Feedback, and Refine: A dashboard is a living tool. Share it with your team, get their feedback, and make continuous improvements to ensure it remains useful and relevant. This iterative process is crucial for long-term success.
Common Mistakes to Avoid When Designing Dashboards
Even with the best tools, a dashboard can fail if not designed correctly. Avoid these common pitfalls.
- Overloading with Too Much Data: A cluttered dashboard is confusing and useless. It’s better to have multiple simple dashboards for different purposes than one complex, overwhelming one.
- Ignoring End-User Needs: A dashboard must solve the user’s problem. If a team member doesn’t find it useful, they won’t use it. Involve your team in the design process to ensure it meets their needs.
- Failing to Update in Real Time: A static dashboard is just a report. Ensure your data sources are connected and automated to provide real-time updates.
- Poor Visualization Choices: Using the wrong chart type can be misleading. For example, a pie chart isn’t great for showing a trend over time—a line graph is much better.
- Lack of Mobile Responsiveness: If your team works on the go, the dashboard must be easily accessible and usable on a phone or tablet.
- Skipping Audits/Iterations: A dashboard should evolve with the project. Regularly review and refine it based on feedback. What worked at the beginning of a project might not be relevant at the end.
- Using Vanity Metrics: Focus on metrics that are actionable and tied to business outcomes, not just metrics that make the project look good (e.g., “number of files created”).
Top Project Dashboard Tools & Software in 2025
Choosing the right tool is a crucial step for building a powerful dashboard for project management. Here are some of the top options in 2025, categorized by team size and purpose.
Karya Keeper 🚀
Karya Keeper is an all-in-one solution for small to mid-size teams that simplifies project planning and delivery. It combines robust task management with powerful dashboards and reporting, making it a standout choice. Its user-friendly interface and focus on core features make it an ideal tool for teams looking for a reliable, no-frills solution.
Key Features:
- Project & task management
- Timesheets & time tracking
- Roles & permissions
- Powerful dashboards & reporting
- Gantt charts and Kanban boards
- Integrated team collaboration tools
Customer Review Highlight:
“Karya Keeper has been a game-changer for our team. Its intuitive interface, robust functionality, and continuous updates have made it an indispensable tool.” – Jyoti Kaushik, E-Tech Services
Pricing: Affordable plans from ₹99/user/month with flexible upgrades.
Other Project Dashboard Tools
Trello:
- Pros: Incredibly easy to use, visually intuitive, and great for personal or small team task management.
- Cons: Limited in functionality for complex projects. Dashboards are an add-on and can be basic.
Asana:
- Pros: Strong task and project progress tracking with highly customizable dashboards. Great for teams that need both simple and complex views.
- Cons: Can be overwhelming for new users. The most powerful dashboard features are in higher-priced plans.
Zoho Projects:
- Pros: A complete, well-integrated project management suite with strong reporting and dashboard capabilities.
- Cons: The user interface can feel a bit dated and less streamlined than newer competitors.
Smartsheet:
- Pros: Combines the familiarity of a spreadsheet with powerful project management, automation, and dashboard features. Extremely flexible.
- Cons: Can have a steep learning curve for those not comfortable with a spreadsheet-like interface.
Birdview:
- Pros: Purpose-built for enterprise solutions with powerful resource management and financial analytics. Provides real-time, customizable dashboards for executives and project teams.
- Cons: Requires a significant investment and may be too complex for smaller teams.
Tableau:
- Pros: The gold standard for data visualization. Can create beautiful, interactive dashboards from virtually any data source.
- Cons: Not a project management tool itself; requires a separate PM tool and data integration. High cost.
Microsoft Power BI:
- Pros: Deeply integrated with the Microsoft ecosystem (Office 365, Teams). Powerful data modeling and visualization capabilities.
- Cons: Can be complex and requires a strong understanding of data structures.
Adobe Workfront:
- Pros: An enterprise-grade work management platform that helps connect strategy to execution. Strong automation and reporting features, with powerful integrations.
- Cons: Geared towards large enterprises, with a corresponding price tag and complexity.
Best Practices for Using Project Dashboards Effectively
Even the best tool can be misused. Follow these best practices to get the most out of your dashboard.
- Keep Dashboards Audience-Focused: A dashboard for a team should show them their daily tasks, not the company’s annual revenue. Tailor the data to the user’s role and needs.
- Use Clear KPIs Instead of Clutter: A few well-chosen metrics are more effective than a screen full of confusing charts. Focus on actionable insights, not just data.
- Automate Updates to Reduce Manual Work: Connect your dashboard to live data sources to ensure it’s always up-to-date. This builds trust and encourages frequent use.
- Customize Dashboards Per Project Type: Tailor each dashboard to the unique needs of a specific project (e.g., a software project vs. a marketing campaign).
- Make Dashboards Mobile-Friendly: In a hybrid work environment, a dashboard that is inaccessible on a phone or tablet is a major failing. Ensure it is responsive and easy to navigate on a small screen.
- Align with Business Strategy: The best dashboards show how project progress contributes to the company’s overall strategic goals. This elevates the dashboard from a simple reporting tool to a strategic asset.
- Provide Context and Explanations: A chart is just a picture without context. Include notes or tooltips that explain what the data means, why it matters, and who is responsible for it.
- Review and Iterate Regularly: A dashboard is not a one-time setup. As your project evolves, so should your dashboard. Hold regular reviews to ensure it’s still providing value.
The Future of Project Dashboards (2025 & Beyond)
The project management dashboard is rapidly evolving. We can expect to see significant advancements in the coming years.
- AI-powered Dashboards: AI will move beyond simple reporting to provide predictive alerts and intelligent suggestions for risk mitigation. They will be able to analyze patterns in historical data to forecast potential issues before they happen.
- Seamless Integration with Tools: Dashboards will be more deeply integrated with collaboration tools like Slack and Teams, bringing data directly into your communication workflow and allowing for more conversational updates.
- Shift from Tracking Hours → Outcomes: The focus will shift from measuring activity (e.g., hours worked) to measuring actual business outcomes (e.g., customer satisfaction, ROI). Dashboards will be built around these high-level metrics.
- Dashboards as the Backbone of Digital Transformation: For many companies, dashboards will become a core part of their strategy to become more data-driven and efficient, helping to break down organizational silos.
- Hyper-Personalization: Dashboards will become more personalized, showing each user only the data that is most relevant to their role and responsibilities.
- Advanced Data Visualization: Expect to see more complex and interactive visualizations, including 3D models and augmented reality (AR) overlays, for a more immersive data experience.
Conclusion: Why Every Team Needs a Project Dashboard
In an era of increasing complexity, the project dashboard is the indispensable tool that brings clarity, speed, and control to every project. It serves as the nerve center for decision-making, enabling teams to move beyond reactive management and into a state of proactive, data-driven leadership.
By adopting this tool, you can save time, improve communication, and ensure your projects are aligned with your business goals. For a simple and powerful solution, try Karya Keeper to unlock your team’s potential with powerful dashboards and reporting.